Database Engine status
OneDrive Data Connections
Report Generator Settings
Compiler Output Console
IdleAgent Performance Summary
View performance stats, errors, and audits across a custom date range.
Agent Performance Breakdown
Sorted by NameNote: Schedulers with a Continuous Service Date (CSD) display operational metrics in Grace (first 19 weeks) / Post-Grace format. Ratings/Levels are calculated based on Post-Grace performance.
| Agent Name | Start Date | Shift Hrs | Avg Aux Time | Avg Aux % | Calls | Call Time | Call % | Idle Time | Idle % | Messages | Appts | Errors | Grace Err | Post Grace | Err/1K | QA Audits | Avg QA | Actions |
|---|---|---|---|---|---|---|---|---|---|---|---|---|---|---|---|---|---|---|
| Click Load Agent Statistics above to query performance metrics. | ||||||||||||||||||
Schedule Adherence
View payroll clock-in/out vs. phone system first-login/last-logout comparisons.
Team Comparison by Supervisor
Summary by Agent
| Agent | Days | Paid Hrs | Phone Hrs | Off-Phone Hrs | Avg Login Gap | Avg Logout Gap | Adherence | Calls | Exceptions | Early Off |
|---|---|---|---|---|---|---|---|---|---|---|
| Click Load Adherence Data above to view stats. | ||||||||||
Agent Detail Focus
Detailed day-by-day payroll vs phone clock times comparison.
| Day | Type | Clock In | Phone In | Login Gap | Clock Out | Phone Out | Logout Gap | Paid Hrs | Phone Hrs | Calls | Flags | Hrs Gap |
|---|
Data Quality & Exceptions
Issues flagged in matching payroll records with the team roster or phone statistics.
| Who / ID | Note |
|---|
Generated Reports History
View and open previously compiled schedule adherence HTML reports.
Success & Recognition Center
Celebrate agent and team achievements over custom date ranges.
🕒 Shift Hours Champions
📞 Call Volume Leaders
🏆 Quality Excellence (QA)
🎯 Precision & Accuracy
⚡ AUX Time Compliance (Lowest)
🌟 AUX Compliant Honor Roll (<15%)
📧 Outlook Email Summary Builder
Generate a styled summary ready to copy and paste directly into Outlook or MS Teams.
Queue Performance Dashboard
Daily Volume & Service Level Trends
👥 Agent Distribution & Call Counts by Queue
| Queue Name | Unique Agents Active | Total Calls Handled | |
|---|---|---|---|
| Click "Load Performance" to load queue data... | |||
AI Historical Trend Analyzer
AHT & Call Volume Trends
Compliance & Availability
Epic & Salesforce Actions
AI Historical Trend Insights Ready
Database Synchronizer
Scan the raw folders in OneDrive and load any new or modified data since **July 1, 2025** into SQLite. This updates rosters, schedules, and metrics.
Individual Data Source Synchronizer
Force a complete re-import of any single data source from OneDrive. This clears its import cache and processes the file/folder immediately.
AI Coaching Configuration
Configure your preferred AI LLM provider to enable automated coaching summaries and staffing tips. If no active provider key is set, reports will use local data rules.
🗂️ Obsidian Vault Integration Local Sync
Export your roster profiles, compiled performance metrics, and AI coaching insights directly to your local Obsidian vault as Markdown notes.
Historical Name Mappings & Corrections
If an agent got married, changed their name spelling, or has a typos in the scheduler, the scheduler data name won't match the current Master Roster. Review the suggestions below to map historical names to roster profiles.
| Unmatched Scheduler Name | Active Range | Suggested Match | Roster CSD | Action |
|---|---|---|---|---|
| Checking suggestions... | ||||
Active Name Mappings
Historical Error Log Name Mappings & Corrections
If an agent name in the Error Log CSV has typos or does not match their current Master Roster key, they will be listed here. Review the suggestions below to map them to active roster profiles.
| Unmatched Error Log Name | Active Range | Suggested Match | Roster CSD | Action |
|---|---|---|---|---|
| Checking suggestions... | ||||
Active Error Log Name Mappings
Queue-to-Supervisor Mappings (Overrides)
Reassign call queues from outdated supervisor records in Excel (e.g., Nikia Miller) to current active supervisors. When you save an override, all metrics for that queue will be dynamically rolled up under the new supervisor in the database.
| Queue Name | Department | Excel Default Supervisor | Assigned Supervisor | Queue Bundle (Group) | Action |
|---|---|---|---|---|---|
| Loading mappings... | |||||
Operational Dashboards & Trend Reports
Trigger and export monthly interactive reports for call volumes, errors, messages, and Actium AI.
ACC Error Log Report
Generates the Summary and Deep-Dive interactive dashboards for scheduler errors from the All Data sheet.
Actium Agent Overview
Generates the Actium call handling overview. Suppresses paused campaign metrics (on hold).
Messages Sent Report
Unions messages tables, de-duplicates by Message ID, and tallies outgoing message counts to clinic pools.
Phone Line Volume
Compiles DNIS offered calls by department and extension from the Merge Calls and Ext Names table.
Execution Log
Generated Dashboards
Interactive Training Manual & Operations Guide
Welcome to the manual for the ACC Report Builder. This document outlines how the application compiles and synchronizes data from OneDrive and local database structures, explaining where the data comes from and how to utilize each tab for Ambulatory Contact Center operations.
1. System Overview
The ACC Report Builder acts as a centralized operational console for contact center leadership. By aggregating and cache-syncing raw telemetry reports and daily error logs from OneDrive, the system automates compiling weekly individual agent and supervisor-level team reports.
Its architecture consists of:
- Data Sync Pipeline: Periodically pulls Excel and CSV files from a shared OneDrive folder, normalizing agent names and caching the contents in a local SQLite database (
acc_performance.db). - Interactive Analytics Views: Provides dashboards for looking up metrics, service levels, agent distributions, quality audits, and historical trends.
- LLM Extensions: Leverages Gemini AI to generate operational insights.
2. Data Sources & Schema
The application is powered by source files stored on the Nebraska Medicine OneDrive directory at:
OneDrive - University of Nebraska Medical Center
| Data Point | OneDrive Path & File Pattern | SQLite DB Table |
|---|---|---|
| Staff Roster | ACC Master Reports File\ACC Master Team List 4.xlsx (Sheet: Master List) |
roster |
| Phone Session Stats | Call Stat Email Reports\Bar Chart Files\All_Schedulers_report.xlsx (or _with_pivottable.xlsx) |
scheduler_stats |
| Epic Messages | ACC Master Reports File\ACC Messages Sent Files\Message Data.xlsx (Sheet: Messages) |
messages |
| Salesforce Guided Actions | Call Stat Email Reports\Salesforce Guided Actions\*.csv |
salesforce_actions |
| Scheduled Appointments | ACC Master Reports File\ACC Appointments Scheduled Reports\Appts Scheduled Recent Data.xlsx (Sheet: Appointments) |
appointments |
| Abandoned at Phone | ACC Master Reports File\Abandoned Calls At Phone Reports\*.csv |
abandoned_calls |
| Agent Queue Splits | Call Stat Email Reports\Agent by Queue Reports\MM-DD-YYYY\PdTaIq[TaskeID].CSV |
queue_performance |
| Queue Volumes & TSF | Processed from Daily Hunt Group performance and Pat Michael Report sheets. | queue_call_stats |
| Quality Audits | ACC Master Reports File\ACC Audits\ACC Audits By Month.xlsx (Sheet: ACC Audits) |
agent_audits |
| Scheduler Error Logs | ACC Master Reports File\Error Log Reporting\Errors for Reporting\*.csv |
agent_errors |
Database Schema Specifications
This table acts as the lookup master to resolve various names from Salesforce, Taske, and Error logs back to a singular agent key (sched_key).
CREATE TABLE roster (
    sched_key TEXT PRIMARY KEY,
    display_name TEXT,
    primary_specialty TEXT,
    taske_id INTEGER,
    key_messages TEXT,
    key_salesforce TEXT,
    key_appts TEXT,
    direct_supervisor TEXT,
    manager TEXT,
    continuous_service_date TEXT,
    error_log_name TEXT,
    email TEXT
);
Stores the core phone and session metrics parsed from the All Schedulers Report.
CREATE TABLE scheduler_stats (
    id INTEGER PRIMARY KEY AUTOINCREMENT,
    sched_key TEXT,
    date TEXT,
    first_login TEXT,
    last_logout TEXT,
    shift_length REAL,
    hours_on_calls REAL,
    calls_per_hour REAL,
    acd_answered INTEGER,
    avg_call_seconds REAL,
    outbound_calls INTEGER,
    outbound_hours REAL,
    aux_time REAL,
    aux_pct REAL,
    idle_pct REAL,
    idle_time REAL,
    queue_name TEXT,
    day_of_week TEXT,
    after_work_time REAL,
    after_work_pct REAL
);
Tab-by-Tab Operations Guide
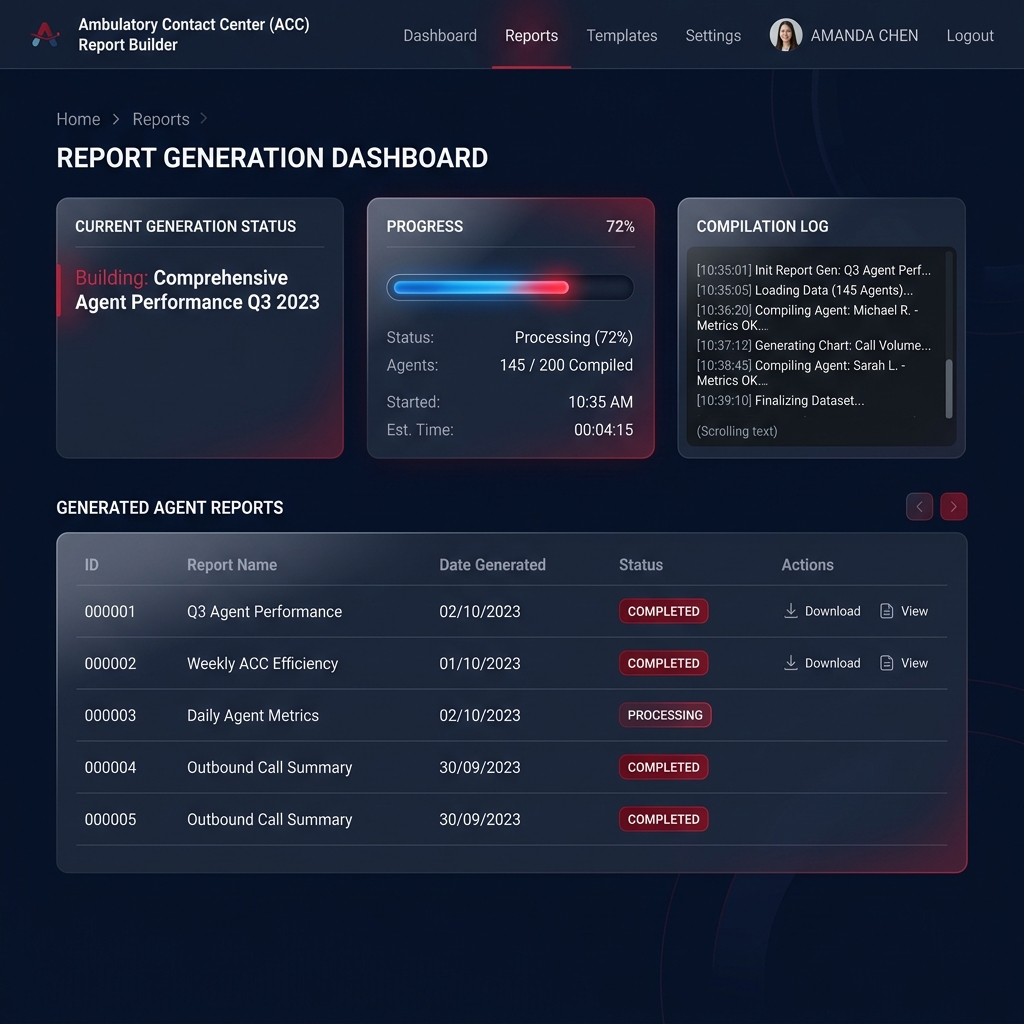
TAB 1 Agent Reports (Builder)
This is the main dashboard and control center of the application. It provides real-time verification of OneDrive file linkages, database status, and coordinates running the Excel compilation pipelines.
Where the Data Comes From
- OneDrive Connections list: Scans files listed in the data directory and pulls their modification timestamps.
- Database Engine status: Queries tables from
acc_performance.dbto show record counts.
How to Use the Tab
- Verify all file status lights are green (files present).
- Select a custom date range using the Date Picker.
- Click Run Generation Pipeline. This executes
weekly_agent_report.pyin a background process. - Monitor the build console. Once complete, select individual agent HTML reports from the sidebar list to inspect their metrics.
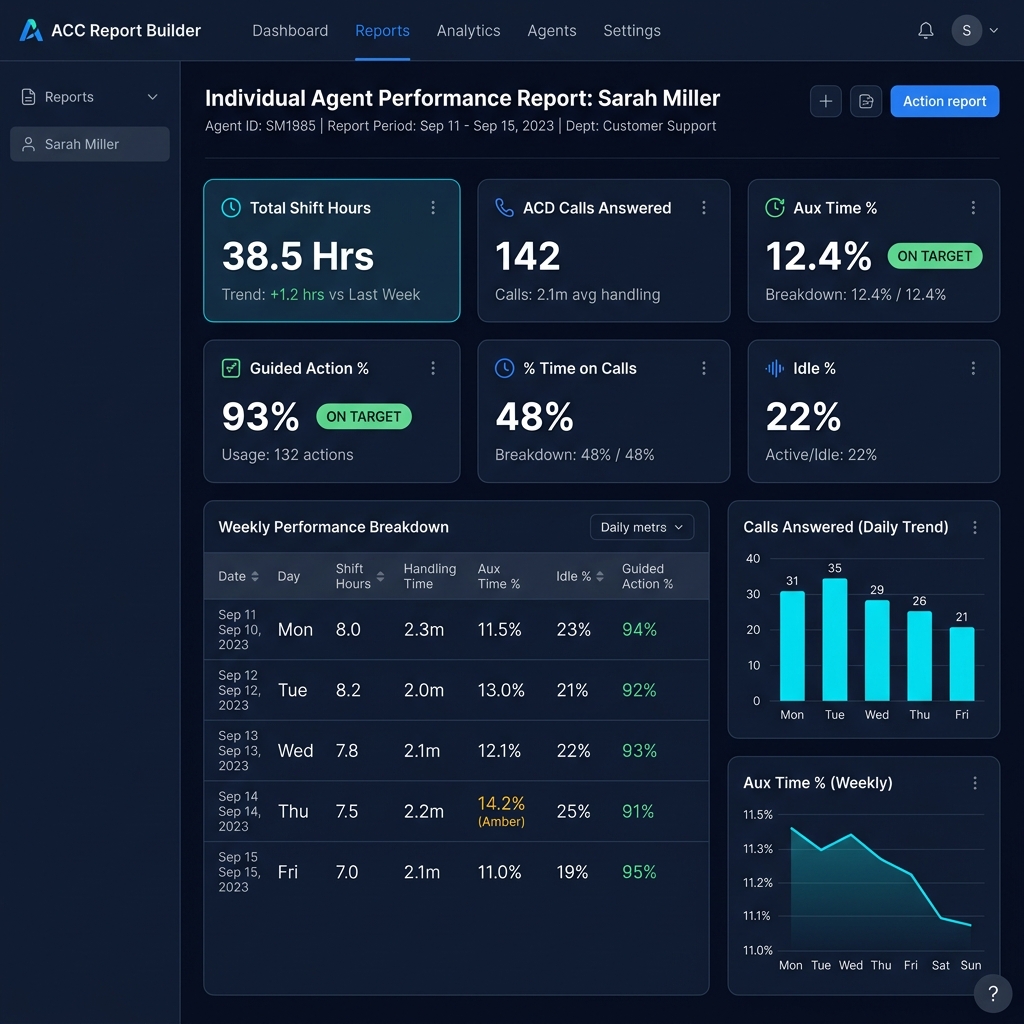
TAB 2 Agent Performance
This view provides a searchable, sortable master grid of performance KPIs for all contact center agents across a chosen date range. It handles aggregating session stats, Salesforce Guided Actions compliance, messaging volumes, scheduled appointments, quality reviews, and error metrics.
Where the Data Comes From
Backed by the /api/performance-summary endpoint. It queries the local database and dynamically aggregates metrics by matching roster entries with performance data tables.
How to Use the Tab
- Use the top filter bar to select a custom Date Range.
- Type an agent's name into the Search field to filter rows immediately.
- Click on column headers (e.g. AHT, Aux %, Calls) to sort the grid.
- Click Export Performance Grid to generate and download a clean, formatted HTML spreadsheet report.
TAB 3 Success & Recognition
Designed to highlight outstanding agent performance and track service milestones. It acts as an automated leaderboard that filters out high compliance, high quality, and error-free agents.
Operational Logic & Data Pipeline
Data is aggregated via /api/recognition-report. The interface highlights achievements based on three primary criteria:
- Aux Compliance: Pulls from
scheduler_stats. Lists agents maintaining an AUX % less than or equal to the target threshold (default: 15%). - Quality Champions: Queries
agent_audits. Highlights agents who have an average score >= 90% in their monthly quality reviews. - Milestones: Resolves
roster.continuous_service_dateand displays upcoming anniversaries.
Exporting Standalone Outlook Email Summaries
By clicking Compile Email Reports, the system triggers the /api/export-success-recognition endpoint. This creates Outlook-compatible HTML reports for each selected supervisor, saving them in a dedicated folder in OneDrive.
- Specialty Sections: If multiple specialties are selected, they will appear as separate sections under the supervisor's report.
- Metrics Selection: Performance elements are scoped to Answered Calls, AUX %, Error log rates, and QA scores.
- Data Warnings: Automatically inserts notices if a specialty segment has zero errors logged or is missing QA audits.
TAB 4 Queue Performance
Displays high-level department metrics for inbound ACD (Automatic Call Distribution) queues, including service levels, abandon rates, offered volumes, and supervisor overrides.
Where the Data Comes From
Sourced from the queue_call_stats and queue_names database tables. The supervisor and lead relations are populated via the queue roster tables, while dynamic overrides are logged in the queue_supervisor_overrides table.
How to Use the Tab
- Filter by Date Range, Department, or Supervisor to scope the KPIs.
- Inspect offered calls, answered calls, abandon rate, average speed of answer (ASA), and telephone service factor (TSF %).
- Use the **Supervisor Override** panel to correct or change the assigned supervisor/lead for a specific ACD queue. This changes leadership assignments on queue reports.
TAB 5 AI Historical Trends
Combines historical charting with generative intelligence to help managers identify systemic patterns, capacity shortfalls, and performance anomalies over long periods.
Operational Logic & Data Pipeline
- Historical Charting: Queries aggregated performance numbers from SQLite, groupable by day, week, month, or day-of-week, and charts call volumes, talk time, messages, and compliance.
- AI Analysis: Executes the
/api/historical-ai-analysisendpoint. It bundles the filtered historical trend data and context, sending it to the Gemini API, which responds with operational summaries, insights, and actionable staffing recommendations.
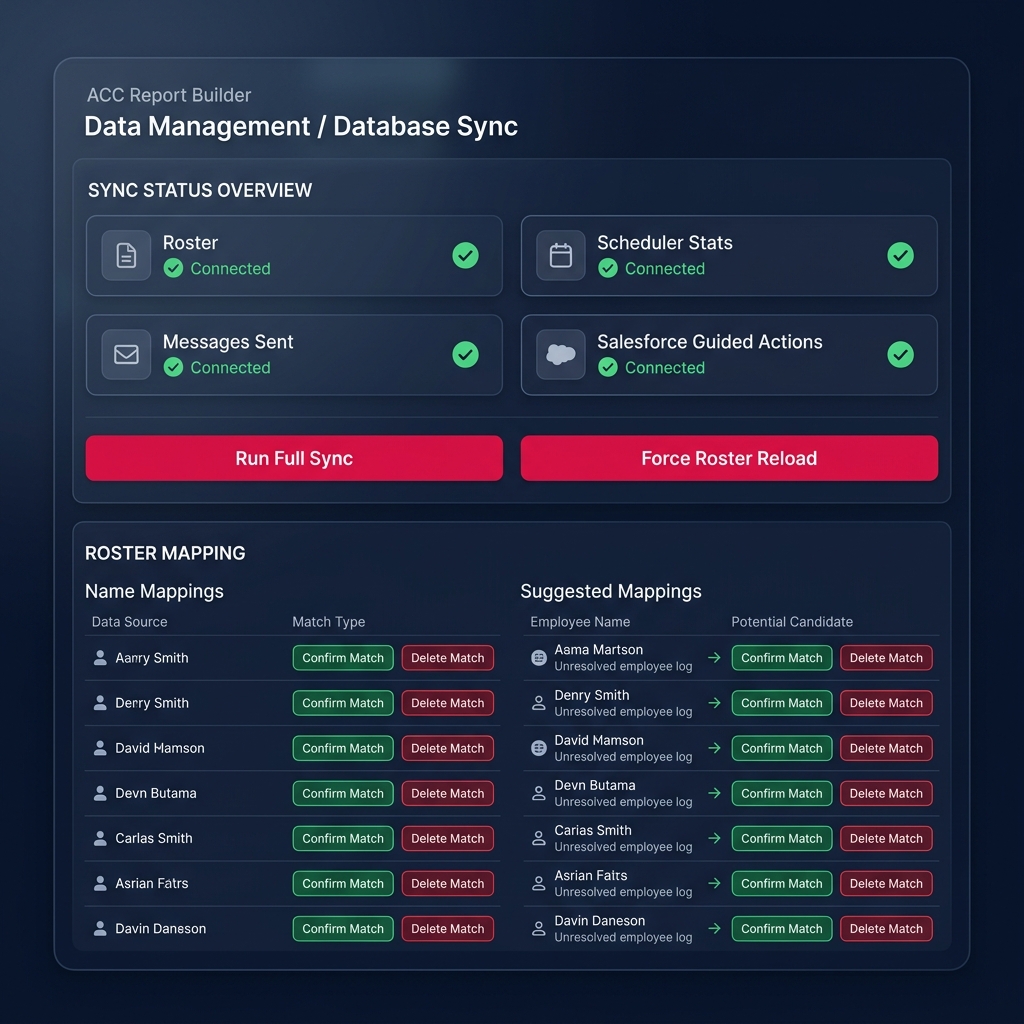
TAB 6 Data Management
The administrative workbench of the ACC Report Builder. It manages local database cache synchronization, mappings for system names, error log mappings, Obsidian sync paths, and Gemini API configs.
Where the Data Comes From
Interacts directly with database configuration tables (name_mappings, error_mappings, app_config). Clicking **Sync Database** runs `db_importer.py` which scans the folders in OneDrive to parse, load, and cache all raw data.
How to Use the Tab
- Click **Sync Database** to load the latest OneDrive files into the cache database. Check 'Force re-import' to overwrite history.
- Use the **Roster Name Matcher** to map names seen in raw telemetry reports to correct Roster keys.
- Use the **Error Log Name Matcher** to map raw error log names to Roster entries.
- Set up Obsidian Sync settings to automatically push compiled rosters.
- Configure LLM parameters and API keys for AI-enabled features.
TAB 7 Operational Dashboards
A utility view that lets leadership compile and export comprehensive operational report bundles (cross-agent reports) as Excel spreadsheets.
Where the Data Comes From
The tab triggers the /api/run-operational-report endpoint. This performs SQL queries on `scheduler_stats`, `messages`, and `agent_errors` to produce consolidated spreadsheets stored in the output directory.
How to Use the Tab
- Select the reporting Date Range.
- Select a report type (e.g. ACC Error Log Report, Actium Agent Overview, Messages Sent Report, Phone Line Volume).
- Click **Compile Operational Dashboard**.
- Once the progress bar completes, click the download icon next to the report name in the generated dashboard list.
Common Troubleshooting & Setup Errors
Occurs if multiple sessions are trying to write or sync simultaneously. Close any background command terminals, wait 10 seconds, and run ACC_Report_Builder.bat again.
Ensure you are logged into your Nebraska Medicine OneDrive account. Verify the folder structure matches exactly. Check the status indicator under the **Agent Reports** tab for missing data files.